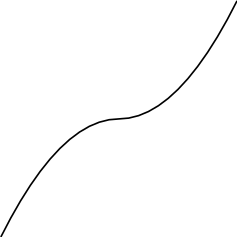
Yet another TeX tip today – I found I wrote this over 6 years ago and never published. So, here it is.
When I need to plot function graphs, the excellent TikZ package is usually my go-to solution. While I really do like TikZ, I have to say it had a nasty surprise for me. Namely, this won’t work correctly:
\documentclass[tikz]{standalone}

\begin{document}
\begin{tikzpicture}
  \draw plot[domain=-1:1] (\x,\x^2);
\end{tikzpicture}
\end{document}
The reason is (more or less) obvious: the minus sign when x<0 “falls out of the square”. Apparently, TikZ performs a simple, textual substitution, so when \x is -1, the arithmetic expression is just -1^2 and not (-1)^2. This version works as expected, though:
\draw plot[domain=-1:1] (\x,{(\x)^2});
(Notice that since the formula contains parens, an additional pair of braces is needed here!)
Unsurprisingly, this works, too:
\draw plot[domain=-1:1] (\x,\x*\x);
Caveat TeXor!
